

October 2024, no. 141
More info
www.marin.nl/publications/wave-in-deck-and-vapour-pocket-model-tests


Create a MARIN account to stay updated

Report
The collapse in turn, leads to a short-duration, large amplitude impact pressure (in the order of 70 bar!). In contrast, when the same experiment is performed with air (instead of water vapour), no collapse is observed. In fact, here the air pocket oscillates which typically gives pressures in the order of only
1 bar. This factor of 70 between these scenarios, reveals the major role of phase change in wave impacts. If such violent impacts with vapour can be obtained in laboratory conditions, could this also happen in a real tank filled with liquefied natural gas (LNG) or liquid hydrogen (LH2)? Clearly, we need a better understanding of the physics behind this.
In 2024, we continued this work by performing similar experiments. This time however, we varied both the temperature and the size of the vapour pockets. We tested three different pockets which can be seen in Figure 1 and Video 1. When the water depth h in the flume is fixed, the wave steepness α = A/h is the only parameter that controls the size of the vapour pocket. Here, is the soliton amplitude.
This was done by examining wave impacts due to breaking waves and by using a combination of water and water vapour. The breaking waves were generated with solitons and a beach.
These preliminary experiments mainly showed that at 20°C, the vapour pocket that is entrapped collapses upon impact into a very localised region near the wall. This happens because the vapour pocket undergoes phase change: in particular, condensation (vapour to liquid).
In the context of LNG transport, this extremely cold liquid is typically transported in large-scale membrane tanks. Due to ship motions, the liquid inside the tank will slosh which creates waves inside these tanks which can lead to impacts on the inner walls of the tank.
In addition, these tanks have to be thermally insulated such that they can withstand extremely cold temperatures
(T≈ -160 °C). Therefore, both mechanical (sloshing) and thermal insulation are key for the optimal design of the tanks. Thus, it is extremely valuable for the industry to gain a better understanding of the physics behind sloshing loads.
The physics of sloshing is extremely complex. It is based on a multiphase flow problem that spans several length scales – from small wave crest instabilities (in the order of mm) to large amplitude waves (representing metres) inside these tanks. One of the main “ingredients” in the list of physical mechanisms is the effect of phase change. In a real tank filled with LNG or liquid hydrogen (LH2) for instance, the cryogenic liquid is always in contact with its own vapour.
In an LNG tank however, this essentially means that the cold liquid can evaporate, and the vapour can condensate back into liquid form. Phase change is therefore ubiquitous in the transport of these cryogenic fuels. However, very little is known about their overall effects on the sloshing loads.
This universal behaviour – as it is commonly referred to – tells us that this unique dimensionless number can be used in other contexts and at different scales, so let us go back to our original question. Can the collapse of a vapour pocket occur in a real LNG tank or LH2 tank? Probably not. In order to see the same kind of large pressures in a real scenario, one would need to have very small and very fast condensing vapour pockets. For instance, for LNG, the model predicts that for a vapour pocket of ≈1 mm in radius, condensation should happen at a speed of nearly 100 m/s which is rather unphysical. For LH2, this is even more dramatic as the pocket would have to be even smaller, ≈1μm. As large pressures are detrimental for the structural integrity of a tank, it is reassuring that the model predicts that these events cannot happen.
We have written a detailed report about this research which will soon be submitted to a prestigious scientific journal in the field of fluid mechanics.
This work is performed in collaboration with the Physics of Fluids Group of the University of Twente via Prof. Devaraj van der Meer and three of his students (Dr. Bernardo Palacios, MSc. Ellis Fan and Dr. Kim Nayoung).
Vapour pocket experiments
As part of the ongoing NWO-Talent Vici programme IMBOL (IMpact of a Boiling Liquid), MARIN conducted wave impact experiments in the Atmosphere facility (ATM) in 2023 to study the effect of phase on wave impacts.

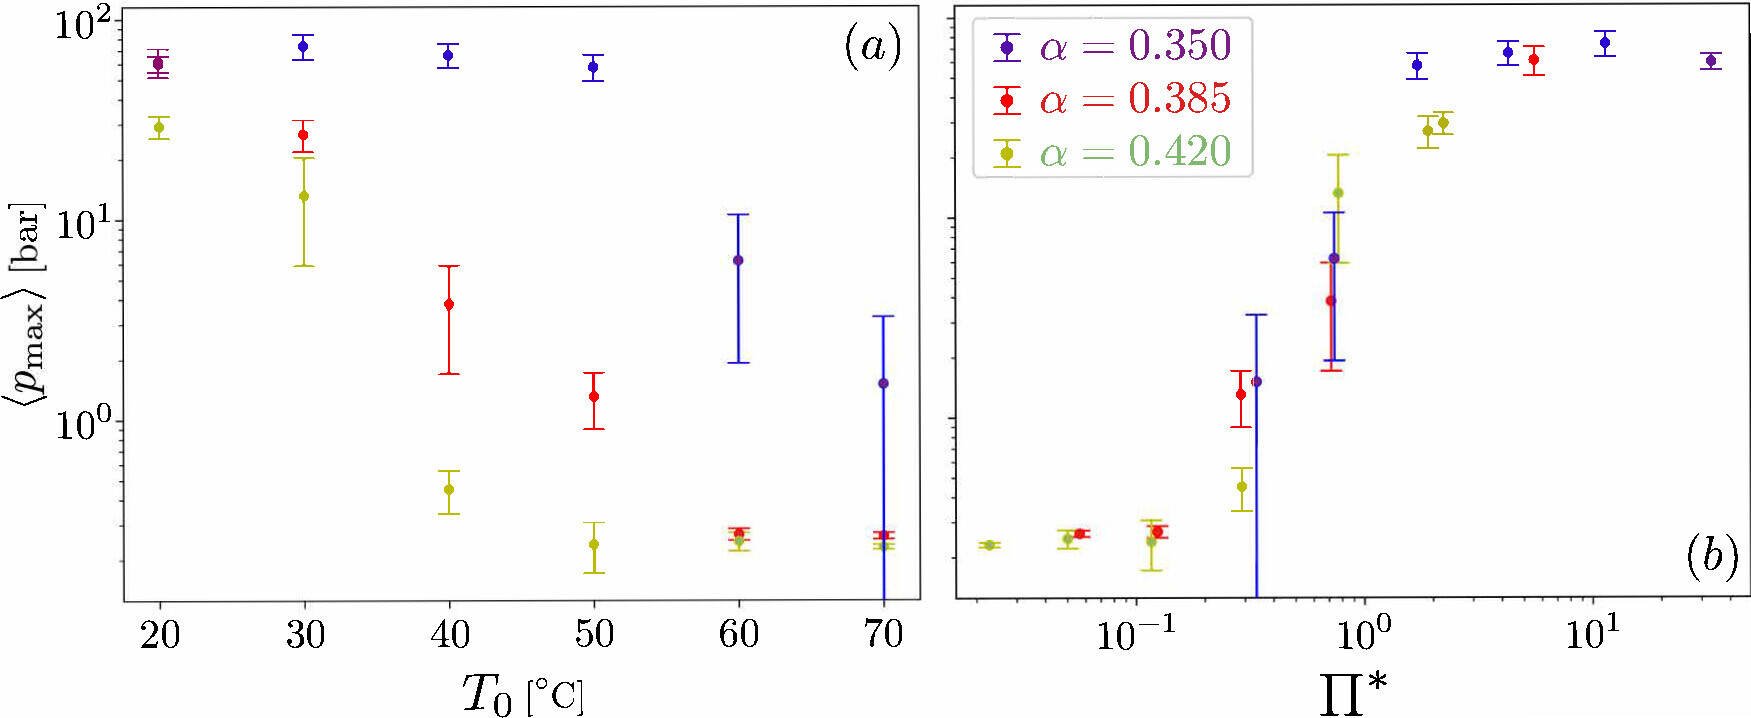
We developed a theoretical model that is able to quantitatively reproduce the behaviour of an equivalent vapour pocket. The model yields a new dimensionless number Π*. This number depends on various fluid properties, the wave kinematics, size of the vapour pocket and the rate at which the vapour pocket condenses. When replotting the experimental data in terms of Π*(Figure 3b), we find that all the data remarkably collapses into a single curve! Furthermore, it clearly reveals two different regimes. When Π* ≫ 1 the pressures are large and associated to the collapse of the vapour pocket, while for Π* ≫ 1, the pressures are low and associated to oscillations – which is certainly consistent with what we see in the experiments.
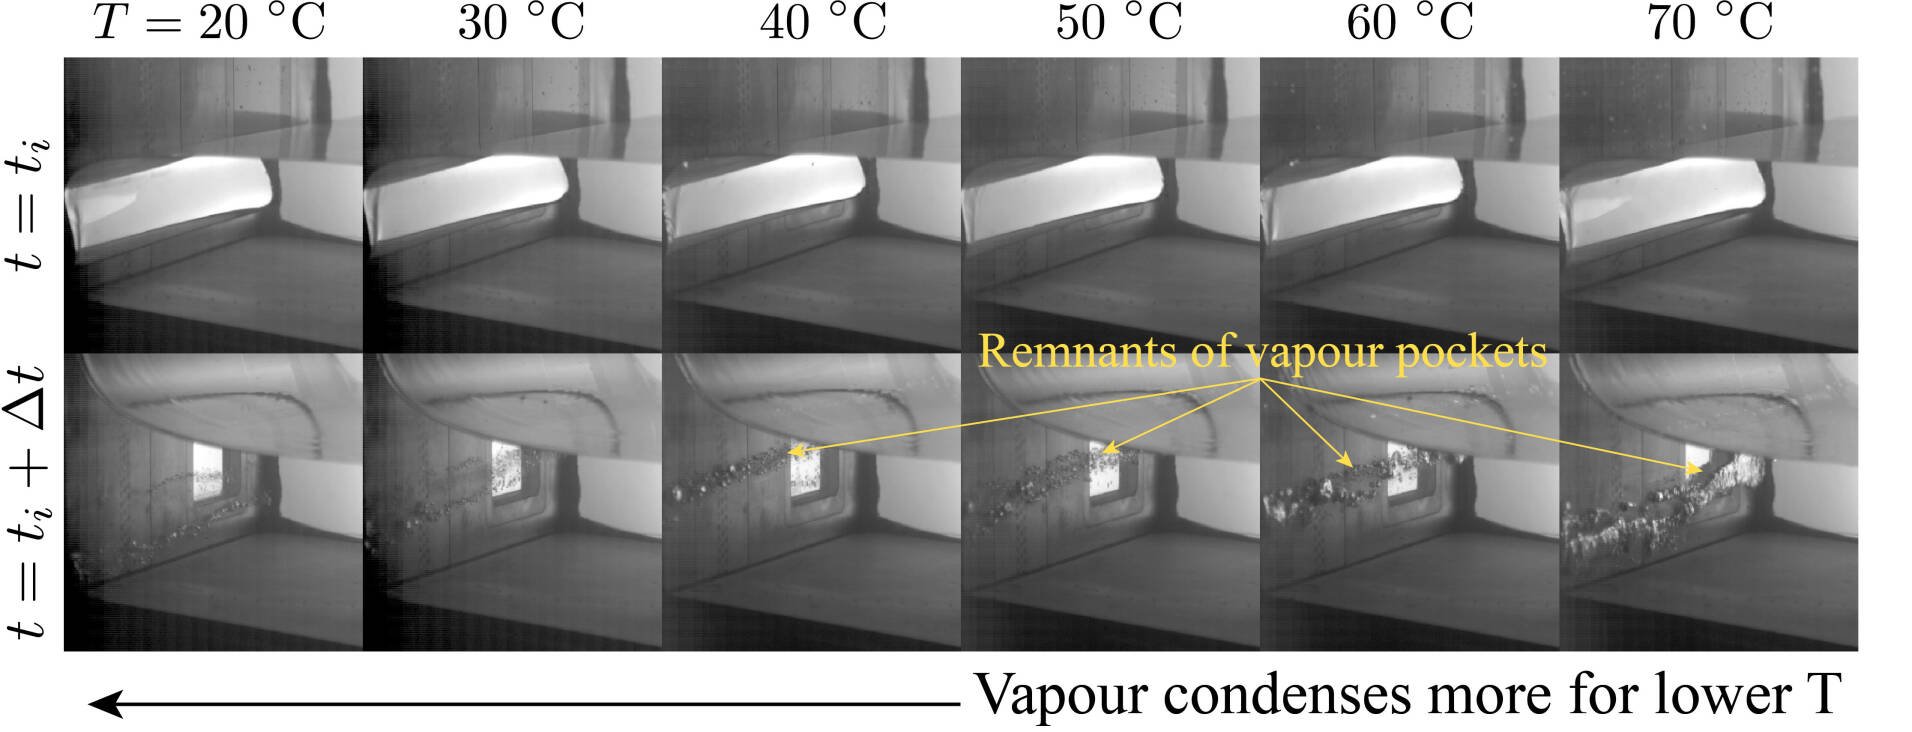
In terms of the temperature, we performed experiments within the range T0 ∈ [20,70] °C. We found that the lower the temperature, the easier it is for the vapour pocket to collapse. As the temperature increases, the collapse is hindered, and more vapour remains after the impact. This can be seen in Figure 2 and Video 2. In addition, we found that the largest pressures are obtained for the lowest temperatures and for the smallest vapour pocket as shown in Figure 3a.
Figure 3a/3b: Maximum pressure due to the collapse of the vapour pocket. In (a), the data is plotted as a function of the temperature. (b) Same data plotted as a function of the dimensionless number Π*, where a nice collapse (i.e. all data falls onto the same curve) can be observed. The different colours represent the three different wave shapes shown in Figure 1.

Video 2. Breaking wave for the smallest vapour pocket ( α=0.35) as a function of temperature. The temperature on the left is T=20 °C and it increases to the right in steps of 10 °C. Note how the entrapped vapour bubble collapses at lower temperatures while at higher temperatures the collapse is hindered, leaving more vapour behind.
Figure 2: Smallest vapour pocket (α = 0.35) at the time of impact ti (top panels) and Δt=100 msl ater (bottom panels). Here, we see that as the temperature increases more vapour remains after impact. This suggests that the condensation process is stronger when the temperature is low. The pressures associated to these events are shown in Figure 3 in purple.

Video 1. The three different vapour pockets we use in this study. These are generated when a soliton interacts with a beach leading to wave breaking close to the wall. From left the right, the size of the vapour pocket is increasing according to the wave steepness α. (left) α=0.35, (middle) α=0.385, (right) α=0.42. The working fluids are water and water vapour at T=20 °.
Figure 1. The three different vapour pockets we use in this study. From left to right, the size of the vapour pocket is increasing according to the parameter α = A/h

Interested? Contact us to discuss your options
Atmosphere Tour.


October 2024, no. 141
Rodrigo Ezeta
Senior researcher Research & Development
In the context of LNG transport, this extremely cold liquid is typically transported in large-scale membrane tanks. Due to ship motions, the liquid inside the tank will slosh which creates waves inside these tanks which can lead to impacts on the inner walls of the tank.
In addition, these tanks have to be thermally insulated such that they can withstand extremely cold temperatures
(T≈ -160 °C). Therefore, both mechanical (sloshing) and thermal insulation are key for the optimal design of the tanks. Thus, it is extremely valuable for the industry to gain a better understanding of the physics behind sloshing loads.
The physics of sloshing is extremely complex. It is based on a multiphase flow problem that spans several length scales – from small wave crest instabilities (in the order of mm) to large amplitude waves (representing metres) inside these tanks. One of the main “ingredients” in the list of physical mechanisms is the effect of phase change. In a real tank filled with LNG or liquid hydrogen (LH2) for instance, the cryogenic liquid is always in contact with its own vapour.
In an LNG tank however, this essentially means that the cold liquid can evaporate, and the vapour can condensate back into liquid form. Phase change is therefore ubiquitous in the transport of these cryogenic fuels. However, very little is known about their overall effects on the sloshing loads.
This universal behaviour – as it is commonly referred to – tells us that this unique dimensionless number can be used in other contexts and at different scales, so let us go back to our original question. Can the collapse of a vapour pocket occur in a real LNG tank or LH2 tank? Probably not. In order to see the same kind of large pressures in a real scenario, one would need to have very small and very fast condensing vapour pockets. For instance, for LNG, the model predicts that for a vapour pocket of ≈1 mm in radius, condensation should happen at a speed of nearly 100 m/s which is rather unphysical. For LH2, this is even more dramatic as the pocket would have to be even smaller, ≈1μm. As large pressures are detrimental for the structural integrity of a tank, it is reassuring that the model predicts that these events cannot happen.
We have written a detailed report about this research which will soon be submitted to a prestigious scientific journal in the field of fluid mechanics.
This work is performed in collaboration with the Physics of Fluids Group of the University of Twente via Prof. Devaraj van der Meer and three of his students (Dr. Bernardo Palacios, MSc. Ellis Fan and Dr. Kim Nayoung).
Figure 3a/3b: Maximum pressure due to the collapse of the vapour pocket. In (a), the data is plotted as a function of the temperature. (b) Same data plotted as a function of the dimensionless number Π*, where a nice collapse (i.e. all data falls onto the same curve) can be observed. The different colours represent the three different wave shapes shown in Figure 1.

Video 2. Breaking wave for the smallest vapour pocket ( α=0.35) as a function of temperature. The temperature on the left is T=20 °C and it increases to the right in steps of 10 °C. Note how the entrapped vapour bubble collapses at lower temperatures while at higher temperatures the collapse is hindered, leaving more vapour behind.
Figure 2: Smallest vapour pocket (α = 0.35) at the time of impact ti (top panels) and Δt=100 msl ater (bottom panels). Here, we see that as the temperature increases more vapour remains after impact. This suggests that the condensation process is stronger when the temperature is low. The pressures associated to these events are shown in Figure 3 in purple.

We developed a theoretical model that is able to quantitatively reproduce the behaviour of an equivalent vapour pocket. The model yields a new dimensionless number Π*. This number depends on various fluid properties, the wave kinematics, size of the vapour pocket and the rate at which the vapour pocket condenses. When replotting the experimental data in terms of Π*(Figure 3b), we find that all the data remarkably collapses into a single curve! Furthermore, it clearly reveals two different regimes. When Π* ≫ 1 the pressures are large and associated to the collapse of the vapour pocket, while for Π* ≫ 1, the pressures are low and associated to oscillations – which is certainly consistent with what we see in the experiments.
The collapse in turn, leads to a short-duration, large amplitude impact pressure (in the order of 70 bar!). In contrast, when the same experiment is performed with air (instead of water vapour), no collapse is observed. In fact, here the air pocket oscillates which typically gives pressures in the order of only
1 bar. This factor of 70 between these scenarios, reveals the major role of phase change in wave impacts. If such violent impacts with vapour can be obtained in laboratory conditions, could this also happen in a real tank filled with liquefied natural gas (LNG) or liquid hydrogen (LH2)? Clearly, we need a better understanding of the physics behind this.
In 2024, we continued this work by performing similar experiments. This time however, we varied both the temperature and the size of the vapour pockets. We tested three different pockets which can be seen in Figure 1 and Video 1. When the water depth h in the flume is fixed, the wave steepness α = A/h is the only parameter that controls the size of the vapour pocket. Here, is the soliton amplitude.
This was done by examining wave impacts due to breaking waves and by using a combination of water and water vapour. The breaking waves were generated with solitons and a beach.
These preliminary experiments mainly showed that at 20°C, the vapour pocket that is entrapped collapses upon impact into a very localised region near the wall. This happens because the vapour pocket undergoes phase change: in particular, condensation (vapour to liquid).
As part of the ongoing NWO-Talent Vici programme IMBOL (IMpact of a Boiling Liquid), MARIN conducted wave impact experiments in the Atmosphere facility (ATM) in 2023 to study the effect of phase on wave impacts.
Vapour pocket experiments
www.marin.nl/publications/wave-in-deck-and-vapour-pocket-model-tests


More info
Interested? Contact us to discuss your options
Report
Video 1. The three different vapour pockets we use in this study. These are generated when a soliton interacts with a beach leading to wave breaking close to the wall. From left the right, the size of the vapour pocket is increasing according to the wave steepness α. (left) α=0.35, (middle) α=0.385, (right) α=0.42. The working fluids are water and water vapour at T=20 °.
Figure 1. The three different vapour pockets we use in this study. From left to right, the size of the vapour pocket is increasing according to the parameter α = A/h

In terms of the temperature, we performed experiments within the range T0 ∈ [20,70] °C. We found that the lower the temperature, the easier it is for the vapour pocket to collapse. As the temperature increases, the collapse is hindered, and more vapour remains after the impact. This can be seen in Figure 2 and Video 2. In addition, we found that the largest pressures are obtained for the lowest temperatures and for the smallest vapour pocket as shown in Figure 3a.
Create a MARIN account to stay updated


