News
Carbon Collectors
Bubble curtains
Floating wind
Wind statistics
Operational advice
Floating Future
Crabbing
Cover
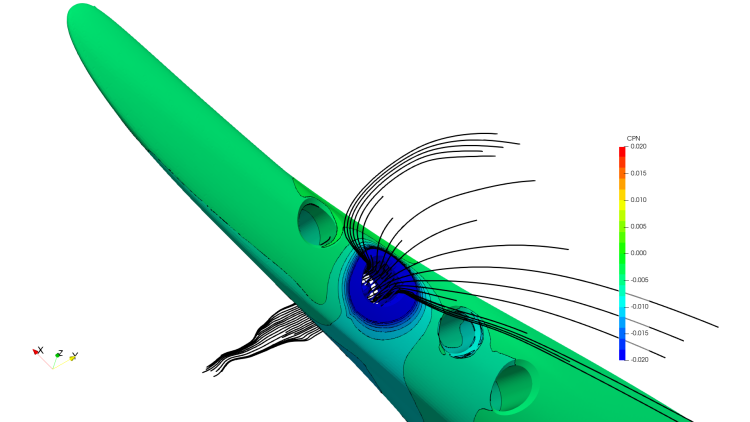
FIgure 6. Dynamic pressure distribution on the forebody (red - high values, blue - low values and black lines – streamlines).

October 2023, no. 137

Flow around the ferry when crabbing
Create a MARIN account to stay updated

Report
Bow thruster analysis by CFD calculations
MARIN invests much time and effort in improving simulation methods for manoeuvrability predictions. Ensuring that ships can operate safely in harbours is crucial in the design process.
In 2023, MARIN helped design a 220-metre-long ferry built by Hyundai Mipo Dockyard and operated by KiwiRail (Figure 1). One of the main requirements was that the ship must be able to safely perform crabbing manoeuvres in severe weather conditions. Usually, the prediction of the crabbing capability for newly built ships is based on model test campaigns (Figure 2), where a model of the vessel performs crabbing manoeuvres in multiple conditions, with varying distances to the quay, water depths and power settings.
Figure 1. Impression of the new KiwiRail ferry.
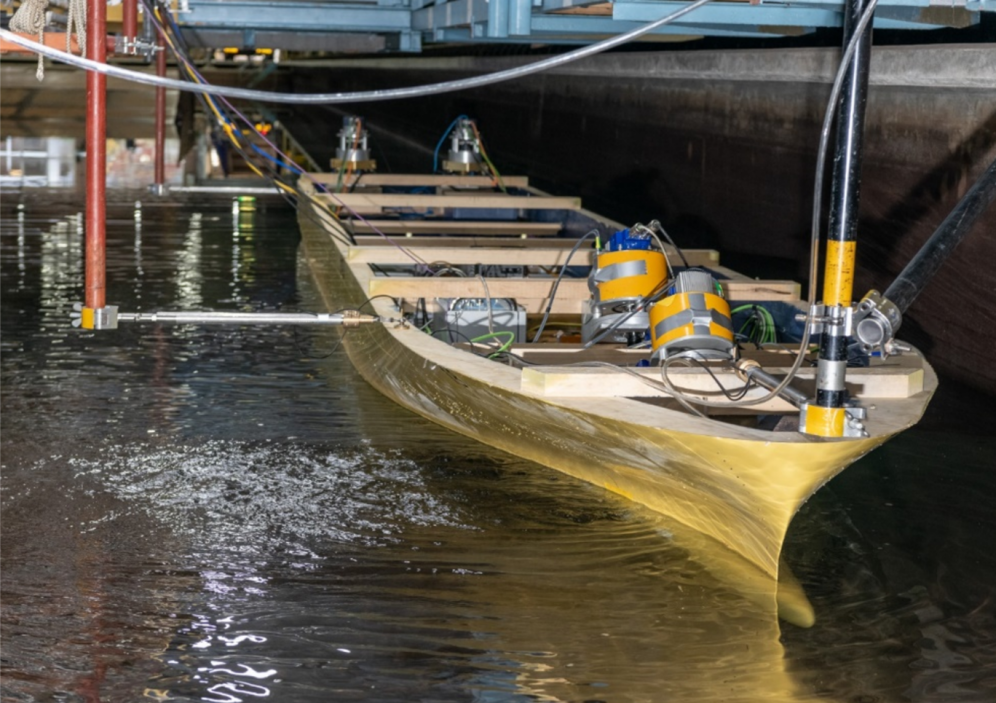
Figure 2. Example of crabbing model tests.
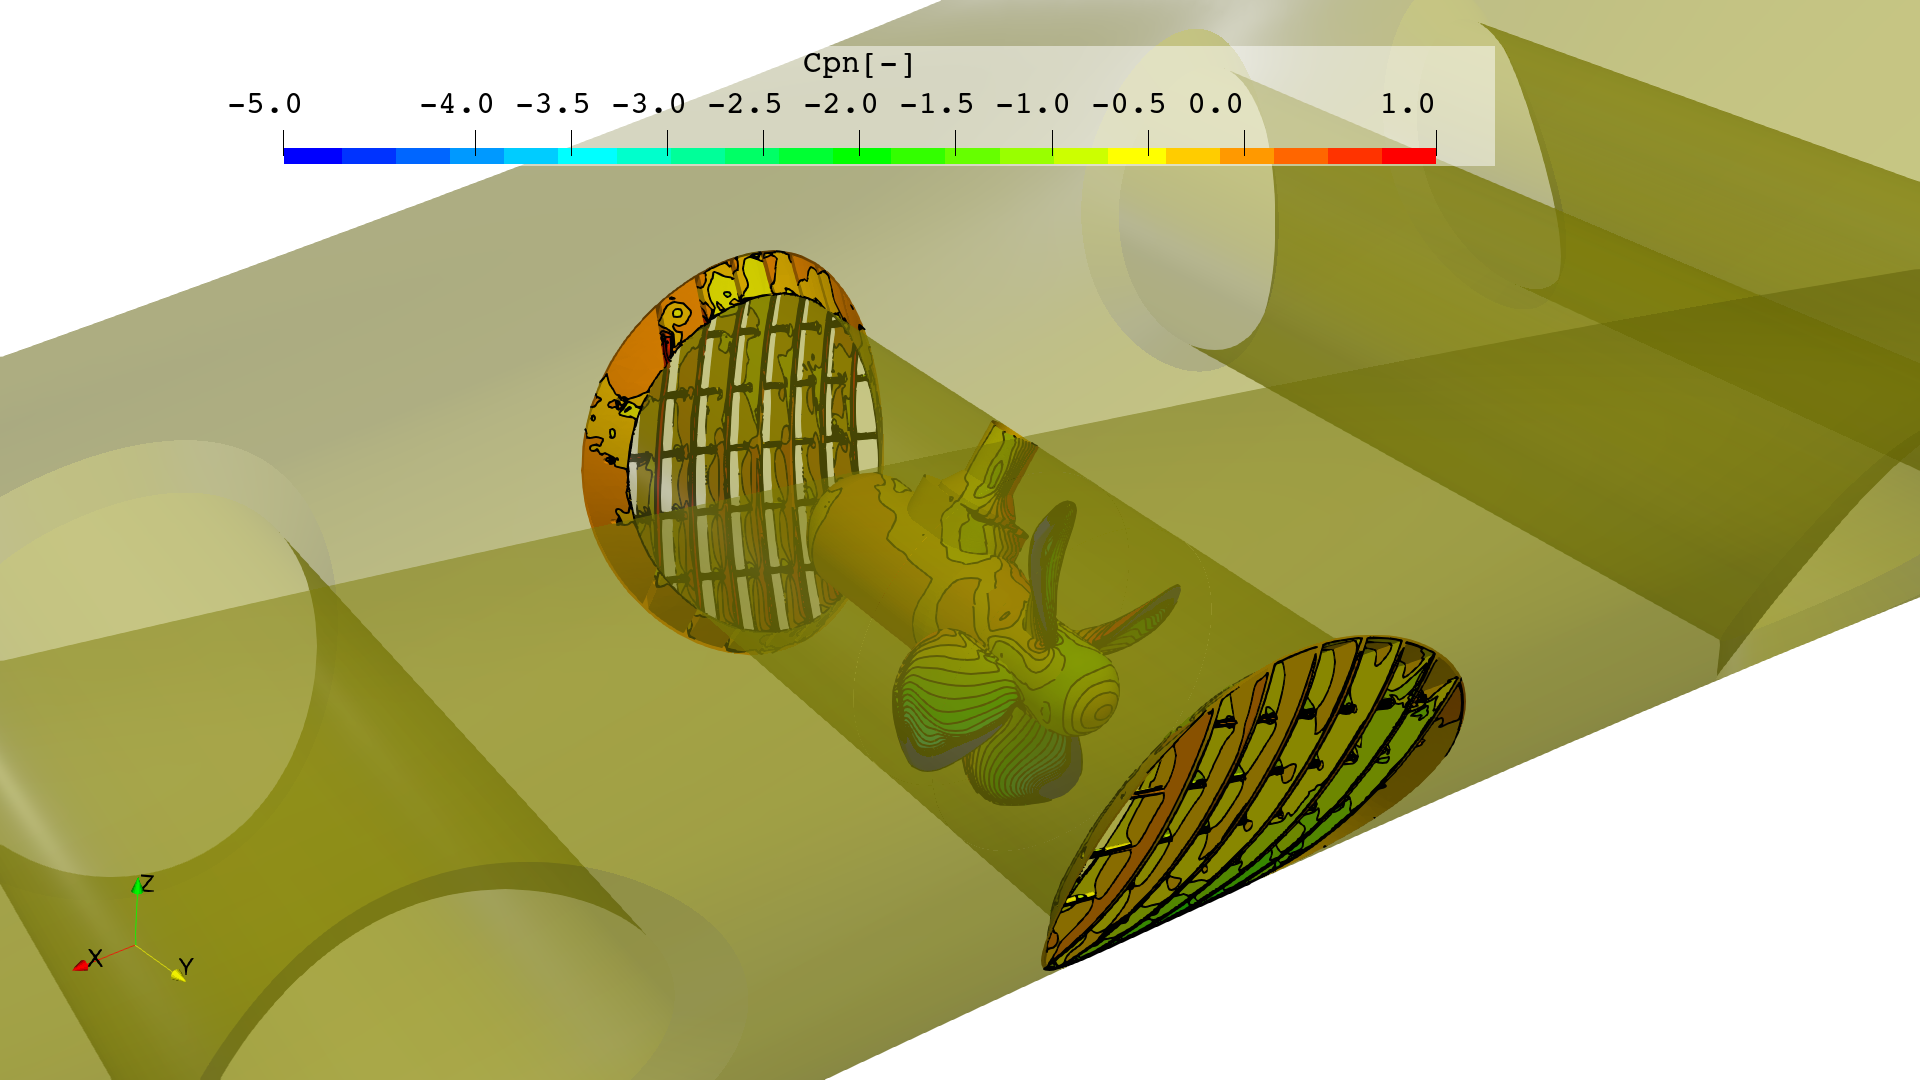
In this project, Hyundai and MARIN decided to go one step further by combining towing tank experiments with modern CFD calculations. Through computer calculations, MARIN analysed the flow around the ferry when crabbing. Among the many critical hydrodynamic elements that affect the manoeuvring ship, the focus was set on analysing interactions between the bow thruster (Figure 3), hull and quay, as these are the driving elements during a crabbing manoeuvre.
Three important objectives were defined in the project. The first was estimating the scale effects on the flow through the bow thruster. Indeed, this is essential for improving the quality of the extrapolation from model-scale experiments to ship-scale operations. The second objective was to understand the sources of these scale effects, to build knowledge about them and find a solution to minimise those effects during extrapolation of the results. The last of the main objectives was to identify the elements which help to increase thruster-hull efficiency in order to design ships that can manoeuvre in harbours more safely and efficiently.
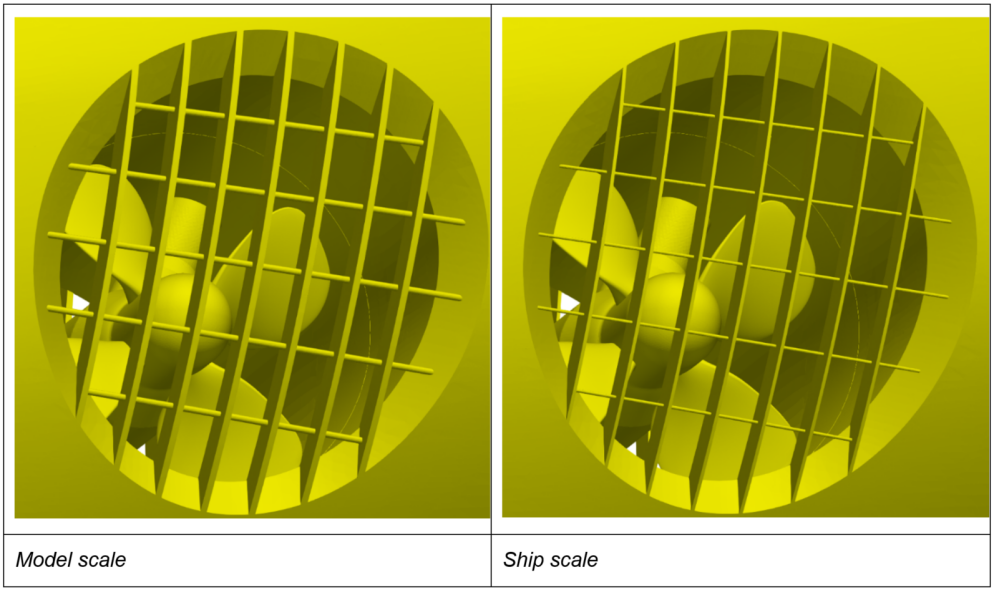
Figure 4. Comparison of thruster grid thickness between model-scale (left figure) and full-scale (right figure).
Figure 3. Dynamic pressure distribution on thruster grids and propeller blades.
In recent years, MARIN put a lot of effort into better understanding how to apply CFD methods to simulate the crabbing manoeuvre. It must be stressed that performing CFD simulations at zero-speed condition is not a trivial task. The absence of predefined main flow direction, blunt body hydrodynamics and large flow separation zones make this condition particularly challenging for numerical fluid mechanics.
Numerical mesh with about 30 million cells
The final numerical mesh had about 30 million cells, with high refinement near boundaries to resolve the boundary layer flow. The RANS-RANS approach was used to model viscous turbulent flow around the ship and rotating propeller.
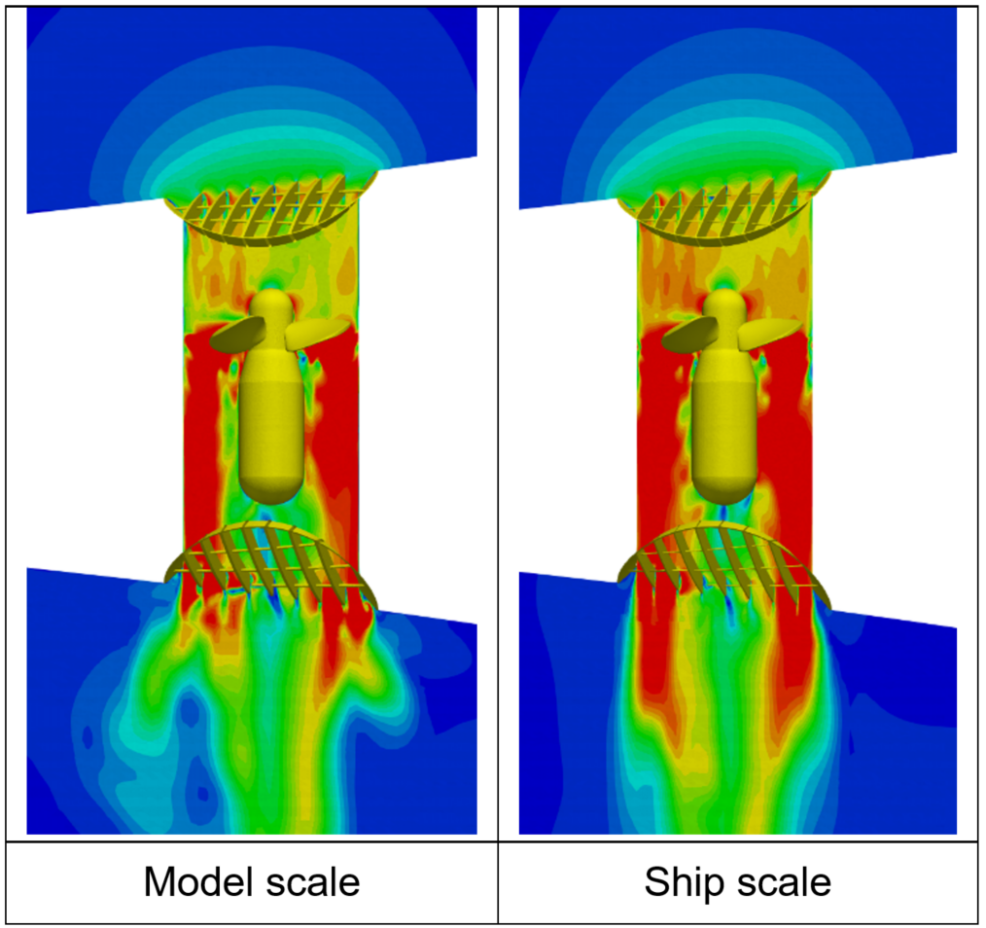
Figure 5. Velocity field in a slice through the bow thruster. Velocity magnitude shown with red identifying high values and blue, low values.
Viscous forces play more dominant role
At model-scale, the viscous forces play a more dominant role than at full-scale. Usually, a relatively thicker boundary layer is observed, the flow tends to separate more often, and waves are less pronounced. In the case of the bow thruster, the thicker grid bars amplified the effect of stronger viscous forces. It led to reduced flow speed through the bow thruster tunnel, increased propeller loading and reduced thruster-hull efficiency. Figure 5 shows the velocity field in a slice through the bow thruster tunnel. Higher velocities (in red) are more dominant in full-scale computations. Thanks to identifying this effect, a more accurate extrapolation was possible.
MARIN conducted two sets of computations to estimate scale effects: at model- and full-scale. These sets enabled the validation of the CFD results with the experiments and the extrapolation to full-scale. Besides linear scaling geometry, the calculations also took into account less obvious differences like bow thruster loading or the relative thickness of the thruster grid bars (Figure 4). Indeed, it is difficult to exactly scale the grid to model size due to the extreme thinness. This is not an issue for powering tests, however this might have an influence on the measured thruster-hull efficiency for crabbing tests.
The CFD computations were also carried out for multiple scenarios such as close and far away from the quay, and when the ship is approaching or leaving the bank. These simulations help better understand the hydrodynamic interactions between the quay and crabbing vessel.
More info

Victor Ferrari
Team Leader Cruise & Ferry


The results also confirm that the presence of the quay can influence the flow in, and out of the thruster. When the distance between the ship and the pier is small, thrusters can induce flow in the confined space between the hull and the bank. In that situation, an additional hydrodynamic force is present. Depending on the ship's motion direction, the force can help or hinder the manoeuvre.
Combining the best of numerical and experimental worlds
Experimental methods provide a lot of valuable knowledge, nonetheless the application of numerical methods, including CFD, has steadily grown in the last decades. Each year, there are constantly new applications and more accurate models developed. That is why it is MARIN's goal in the coming years to combine the best of numerical and experimental worlds to design cleaner, safer and smarter ships.
Due to the interaction between the bow thruster and the hull close to the tunnel's inlet, the flow is accelerated and the dynamic pressure is lowered. The low pressure zone is marked with a deep blue colour in Figure 6. These phenomena result in an additional hydrodynamic force acting on the hull and increase the thruster-hull efficiency. The magnitude of the force can be improved by modifying the thruster inlet geometry.
In contrast to the inlet side, where the flow should be attached to the hull to increase the positive effects of thruster hull interactions on the outlet side, the geometry must allow the flow to separate from the hull as soon as possible. Otherwise, it leads to recirculation zones and a decrease in thruster-hull efficiency.

Tomasz Gornicz
Manoeuvring CFD Specialist


Tomasz Gornicz
Manoeuvring CFD Specialist
Victor Ferrari
Team Leader Cruise & Ferry
Flow around the ferry when crabbing
More info
The results also confirm that the presence of the quay can influence the flow in, and out of the thruster. When the distance between the ship and the pier is small, thrusters can induce flow in the confined space between the hull and the bank. In that situation, an additional hydrodynamic force is present. Depending on the ship's motion direction, the force can help or hinder the manoeuvre.
Combining the best of numerical and experimental worlds
Experimental methods provide a lot of valuable knowledge, nonetheless the application of numerical methods, including CFD, has steadily grown in the last decades. Each year, there are constantly new applications and more accurate models developed. That is why it is MARIN's goal in the coming years to combine the best of numerical and experimental worlds to design cleaner, safer and smarter ships.
Due to the interaction between the bow thruster and the hull close to the tunnel's inlet, the flow is accelerated and the dynamic pressure is lowered. The low pressure zone is marked with a deep blue colour in Figure 6. These phenomena result in an additional hydrodynamic force acting on the hull and increase the thruster-hull efficiency. The magnitude of the force can be improved by modifying the thruster inlet geometry.
In contrast to the inlet side, where the flow should be attached to the hull to increase the positive effects of thruster hull interactions on the outlet side, the geometry must allow the flow to separate from the hull as soon as possible. Otherwise, it leads to recirculation zones and a decrease in thruster-hull efficiency.
FIgure 6. Dynamic pressure distribution on the forebody (red - high values, blue - low values and black lines – streamlines).
Viscous forces play more dominant role
At model-scale, the viscous forces play a more dominant role than at full-scale. Usually, a relatively thicker boundary layer is observed, the flow tends to separate more often, and waves are less pronounced. In the case of the bow thruster, the thicker grid bars amplified the effect of stronger viscous forces. It led to reduced flow speed through the bow thruster tunnel, increased propeller loading and reduced thruster-hull efficiency. Figure 5 shows the velocity field in a slice through the bow thruster tunnel. Higher velocities (in red) are more dominant in full-scale computations. Thanks to identifying this effect, a more accurate extrapolation was possible.
Figure 5. Velocity field in a slice through the bow thruster. Velocity magnitude shown with red identifying high values and blue, low values.
MARIN conducted two sets of computations to estimate scale effects: at model- and full-scale. These sets enabled the validation of the CFD results with the experiments and the extrapolation to full-scale. Besides linear scaling geometry, the calculations also took into account less obvious differences like bow thruster loading or the relative thickness of the thruster grid bars (Figure 4). Indeed, it is difficult to exactly scale the grid to model size due to the extreme thinness. This is not an issue for powering tests, however this might have an influence on the measured thruster-hull efficiency for crabbing tests.
The CFD computations were also carried out for multiple scenarios such as close and far away from the quay, and when the ship is approaching or leaving the bank. These simulations help better understand the hydrodynamic interactions between the quay and crabbing vessel.

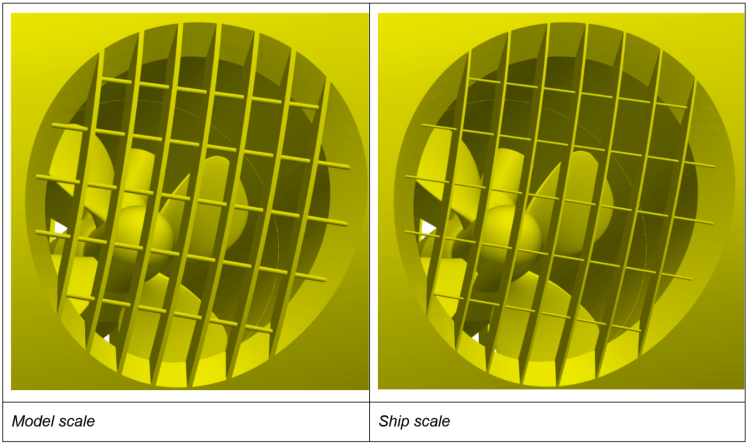
Figure 4. Comparison of thruster grid thickness between model-scale (left figure) and full-scale (right figure).
In recent years, MARIN put a lot of effort into better understanding how to apply CFD methods to simulate the crabbing manoeuvre. It must be stressed that performing CFD simulations at zero-speed condition is not a trivial task. The absence of predefined main flow direction, blunt body hydrodynamics and large flow separation zones make this condition particularly challenging for numerical fluid mechanics.
Numerical mesh with about 30 million cells
The final numerical mesh had about 30 million cells, with high refinement near boundaries to resolve the boundary layer flow. The RANS-RANS approach was used to model viscous turbulent flow around the ship and rotating propeller.
Figure 3. Dynamic pressure distribution on thruster grids and propeller blades.

Three important objectives were defined in the project. The first was estimating the scale effects on the flow through the bow thruster. Indeed, this is essential for improving the quality of the extrapolation from model-scale experiments to ship-scale operations. The second objective was to understand the sources of these scale effects, to build knowledge about them and find a solution to minimise those effects during extrapolation of the results. The last of the main objectives was to identify the elements which help to increase thruster-hull efficiency in order to design ships that can manoeuvre in harbours more safely and efficiently.
Figure 1. Impression of the new KiwiRail ferry.
Figure 2. Example of crabbing model tests.

In this project, Hyundai and MARIN decided to go one step further by combining towing tank experiments with modern CFD calculations. Through computer calculations, MARIN analysed the flow around the ferry when crabbing. Among the many critical hydrodynamic elements that affect the manoeuvring ship, the focus was set on analysing interactions between the bow thruster (Figure 3), hull and quay, as these are the driving elements during a crabbing manoeuvre.
In 2023, MARIN helped design a 220-metre-long ferry built by Hyundai Mipo Dockyard and operated by KiwiRail (Figure 1). One of the main requirements was that the ship must be able to safely perform crabbing manoeuvres in severe weather conditions. Usually, the prediction of the crabbing capability for newly built ships is based on model test campaigns (Figure 2), where a model of the vessel performs crabbing manoeuvres in multiple conditions, with varying distances to the quay, water depths and power settings.
October2023, no. 137
MARIN invests much time and effort in improving simulation methods for manoeuvrability predictions. Ensuring that ships can operate safely in harbours is crucial in the design process.
Bow thruster analysis by CFD calculations
Report